
Three decks, no common line
Pull up the last three monthly decks from your inventory advertising vendor and write down the headline number on the first page of each. If the first month leads with impressions and reach, the second with engaged sessions after a pixel update, and the third with VDP views, assisted conversions or a "shopper engagement" figure defined in a footnote, you have the report this article is about. Each page is honest, each one is different, and the number that led last month is not on this month's page for comparison.
Check the definition of a lead on the same three decks. If chat was added, chats count from that month. If the call tracking number changed, calls count differently. The cost per lead on page three moves, and the store changed nothing. A GM reading that deck in the Monday meeting cannot answer the question he brought to the meeting: is this program doing better or worse than it did last month, for what it costs?
A shopper's path gives a report many things to count. The 2025 Cox Automotive Car Buyer Journey Study puts total shopping time at 13 hours 13 minutes, of which 7 hours 11 minutes is online, and finds that 63% of buyers would prefer a blend of online and in-store, with 19% of all buyers using AI websites or AI-generated overviews along the way (Cox Automotive, 2025 Car Buyer Journey Study). Every one of those touches can be counted, and a report that picks a new touch each month is picking what to count. The money it describes is not small: franchised dealers spent $9.96 billion on advertising in 2025, $739 per new vehicle retailed, up $34 from 2024, with digital media at 74.9% of the total (NADA Data 2025 as reported by Dealership Guy News).
Seven lines, defined once
Carumai picks the car. An inventory ad is bought for one exact vehicle, so the count that stays fixed is the count on that vehicle: was it advertised, for how long, at what cost, did its page get more attention while the ad ran, did it sell while advertised, how long had it been on the lot when it did. Those questions have the same answer format in January and in August, and they are the seven lines.
Carumai is a VIN-level inventory operating system, and it reports itself on seven lines that do not change. Each is defined in one sentence, and the definition is the same on every screen, in every export and in every month.
- Cars advertised: every VIN with advertising behind it in the period, used and new counted separately.
- Spend: the cost on those cars, with the engine's spend and the dealer's manual channels shown separately.
- Cost per car-week: spend divided by car-weeks, one car advertised for one week being one car-week, with CPM and CPC beside it.
- Cars sold while advertised: every car on the Delisted export, wholesale excluded.
- Views per week before versus on ads: for each car first advertised in the period, its VDP views per week in the week before the ad started against its first week on ads, each car against itself; the share of cars up.
- Days on lot at sale: the days on lot of cars sold while advertised against every front-line exit at the store.
- Zero-lead coverage: the share of front-line cars with no leads, on the day of the read, that have Carumai advertising behind them, used and new separately.
New and used are always separate. Every number is shown as measured. There is no eighth line added in a good month and no line dropped in a poor one. The honest measure takes each line in turn and explains what a dealer should demand of any inventory advertising program on it.
Where the lines come from
The seven lines are the measure Carumai reports itself on, and the same definitions run through the product. Every metric on the VIN card, the Manager SRP, the VIN Ads report and Carumai Daily has one definition used everywhere, so the views number a manager sees on a car on Tuesday is the views number in the reporting at month end. The VIN Ads report shows, for any date range and store, how many VINs were advertised, when, on which platforms, at what support level, for how long, at what cost, and what happened to them, retail sale, wholesale exit or still in stock, shown as outcomes.
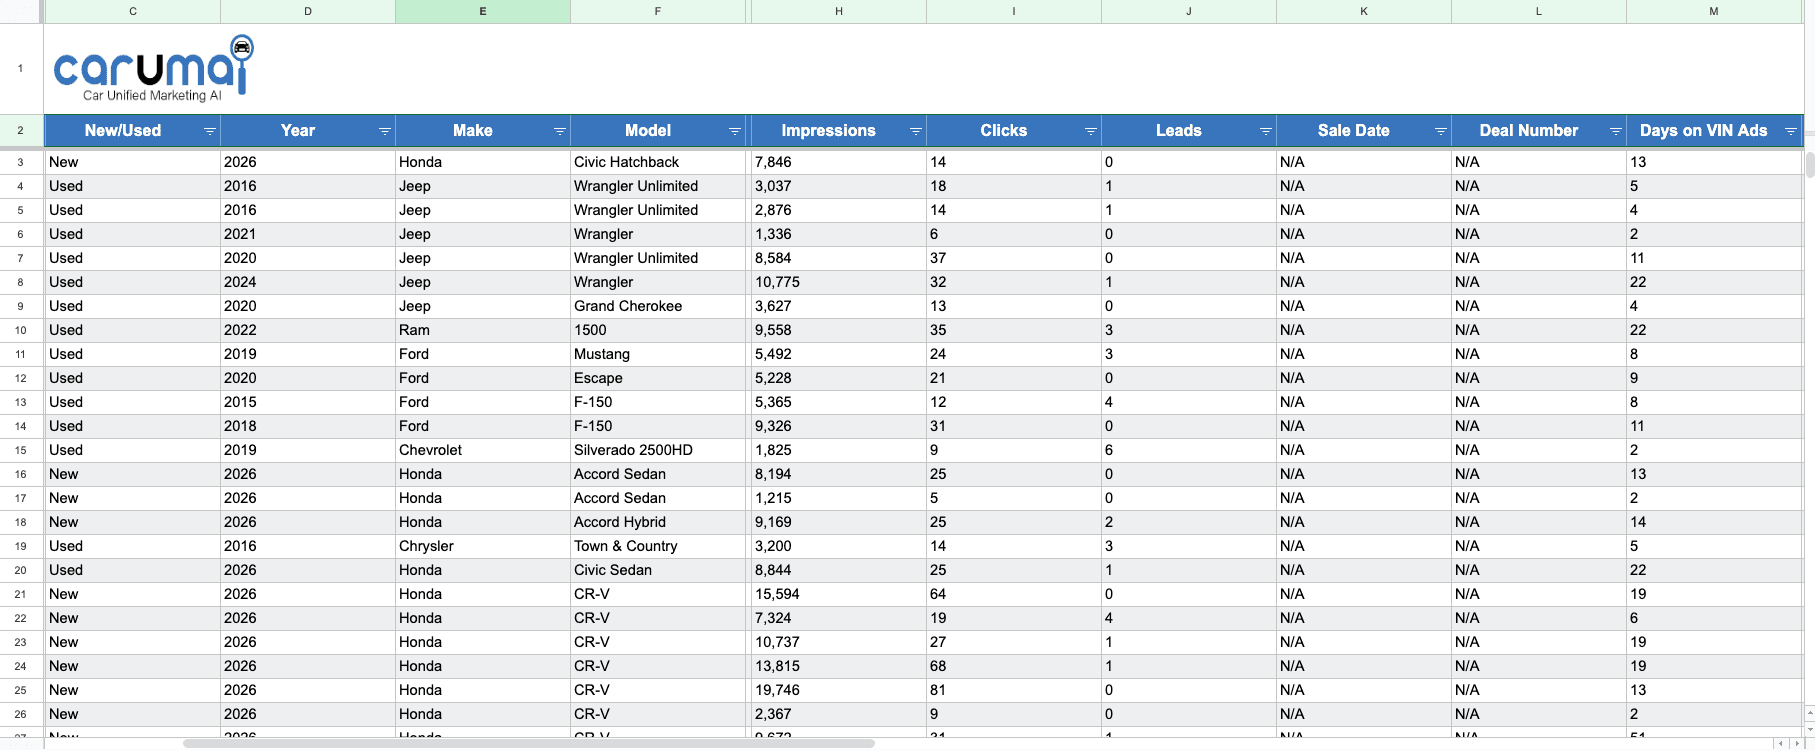
Two weekly exports and the inventory export put the same definitions in a spreadsheet a GM opens himself. The Listed export names every car advertised that week with its cost, impressions and clicks. The Delisted export names every advertised car that retail-sold that week with its sale date, wholesale removed before export. The inventory export carries Views, Leads, Leads This Month, Active Shoppers, Appointments and Spend Level for every VIN. The weekly export a GM can read walks through each file.
The audit sits under all of it. Every readiness change, support-level change, stop, override, channel change, budget change, ad start and stop, lead delivery and export is recorded, so if a line moves, the reason is on the car and not in a footnote.
What a GM does with a fixed report
Compare. That is the whole point. Put August beside July and the lines are the same lines; put one store beside another and the columns are the same columns. When cost per car-week rises at one rooftop, the next question is why, and the VIN Ads report answers it by car. When cars sold while advertised falls, the Delisted export shows which cars were on ads and which exits were not. A report that holds still lets a manager ask the second question instead of relearning the first one every month.
If you want to see the seven lines on your own inventory, bring one inventory export to a 20-minute demo and we will show you your zero-lead list and your coverage: book a 20-minute demo.
Frequently asked questions
What should an inventory advertising report include?
The same lines every month, defined once and in one order: cars advertised, spend, cost per car-week with CPM and CPC, cars sold while advertised, views per week before versus on ads for each car against itself, days on lot at sale against every front-line exit at the store, and zero-lead coverage, with new and used stated separately.
Why does a dealership marketing report change every month?
A report that leads with a different headline metric each month is choosing what to count. Ask what changed behind it: a pixel update, a new chat provider, a new call tracking number. Then ask for the prior month's value of every number on the page and the written definition of each one.
What does sold while advertised mean?
Sold while advertised is every car on Carumai's Delisted export that retail-sold in the period, with wholesale exits removed before export. It is a count of advertised cars that sold, stated with the spend on those cars beside it, new and used separately, and it is defined the same way every month.
Sources
- NADA Data 2025 as reported by Dealership Guy News, "Dealer ad spend nears $10 billion as digital marketing dominates". https://news.dealershipguy.com/p/dealer-ad-spend-nears-10-billion-as-digital-marketing-dominates
- Cox Automotive, 2025 Car Buyer Journey Study (research conducted fall 2025, released January 13, 2026). https://www.coxautoinc.com/insights/cox-automotive-car-buyer-journey-study-finds-efficiency-digital-tools-and-ai-drive-record-satisfaction/